
Introduction
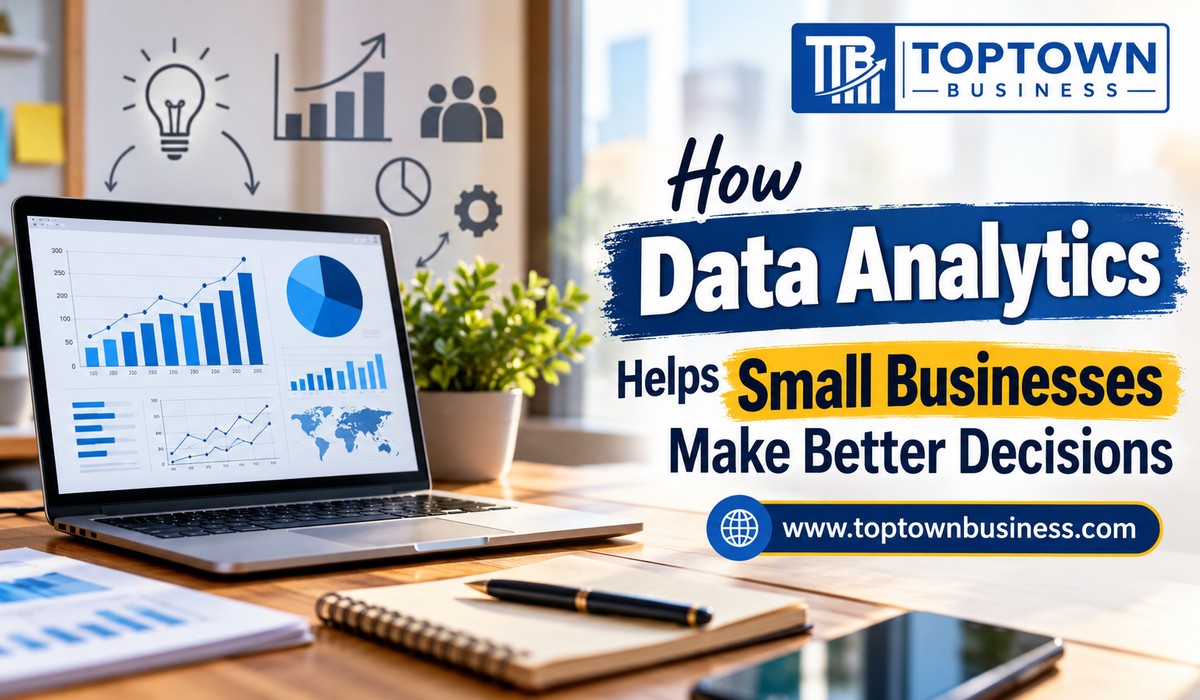
Running a small business requires owners to make important decisions every day. You must manage expenses, understand customer needs, monitor sales, and plan for future growth. However, making these decisions based only on experience or intuition can lead to missed opportunities. This is where data analytics for small businesses becomes valuable.
Data analytics helps business owners turn everyday business information into useful insights. By reviewing sales figures, customer feedback, website activity, and operating costs, you can identify patterns and understand what works best for your business. As a result, you can make informed decisions instead of relying entirely on assumptions.
Moreover, data analytics does not require a large budget or a dedicated team of experts. Small businesses can begin with simple spreadsheets, accounting software, customer relationship management systems, and website analytics tools. Over time, they can introduce more advanced methods as their needs change.
Whether you operate a retail shop, a service company, an online store, or a local business, data can help you improve efficiency and manage resources more effectively. The key is to collect relevant information, interpret it correctly, and use the findings to support practical business decisions.
What Is Data Analytics for Small Businesses?
Data analytics is the process of collecting, organizing, examining, and interpreting information to identify useful patterns and support decisions. For small businesses, this information often comes from daily activities such as sales transactions, customer interactions, marketing campaigns, inventory records, and financial reports.
Instead of looking at individual transactions separately, business owners can examine the information together. This approach helps reveal trends that may otherwise remain unnoticed.
For example, a bakery might notice that certain products sell more frequently on weekends. By reviewing sales records, the owner can adjust production levels and reduce the risk of preparing too much or too little stock.
Similarly, a digital marketing agency can review campaign performance to determine which channels attract qualified leads. Consequently, the business can allocate its marketing budget more carefully.
Common Types of Business Data
Small businesses can use several types of data to understand their performance.
- Sales data: Revenue, order volumes, average transaction values, and product performance.
- Customer data: Purchase history, preferences, feedback, and repeat purchases.
- Financial data: Operating expenses, profit margins, cash flow, and outstanding payments.
- Marketing data: Website visits, advertising costs, email engagement, and lead conversions.
- Operational data: Inventory levels, delivery times, staff workloads, and order processing times.
Each category provides a different perspective. When you combine relevant information, you can develop a clearer understanding of your business and identify areas that need attention.
How Data Analytics Helps Small Businesses Make Better Decisions
Data analytics supports better decisions by replacing guesswork with measurable evidence. Although experience remains important, business owners can use reliable information to test assumptions and compare possible actions.
1. Understand Customer Behaviour
Understanding customers is essential for building a sustainable business. However, customer preferences can change because of pricing, convenience, seasonal demand, and competition.
Data analytics helps you understand what customers purchase, how frequently they return, and which products or services attract the most interest.
For example, an online clothing store may discover that customers frequently purchase certain products after visiting a particular category page. This information can help the owner improve product placement and create more relevant promotions.
Customer information can also reveal why people stop purchasing. If repeat orders decline, the business can review customer feedback, delivery performance, product availability, and pricing.
As a result, you can make improvements that address actual customer needs rather than relying on assumptions.
2. Improve Financial Planning
Financial management plays a major role in small business success. Even businesses with healthy sales can experience difficulties when expenses increase or payments arrive late.
Data analytics helps owners monitor income, expenses, margins, and cash flow. By reviewing these figures regularly, you can identify unnecessary costs and plan for upcoming financial commitments.
For instance, a service business might find that one project category generates strong revenue but requires excessive staff hours. After examining labour costs and project expenses, the owner can revise pricing or adjust the way the team delivers that service.
Financial analytics can help you:
- Compare actual spending with your budget.
- Identify rising operating expenses.
- Review profit margins across products and services.
- Monitor unpaid invoices and payment delays.
- Estimate future cash requirements using historical patterns.
However, historical results do not guarantee future performance. Therefore, use financial data alongside current market conditions, planned expenses, and realistic assumptions.
3. Make Smarter Marketing Decisions
Small businesses often operate with limited marketing budgets. Consequently, spending money on campaigns that do not attract suitable customers can reduce profitability.
Data analytics allows you to compare marketing channels and evaluate their performance. You can review website traffic, enquiries, conversions, customer acquisition costs, and sales generated by different campaigns.
Suppose a local fitness studio advertises through social media, email, and printed flyers. By tracking enquiries and new memberships from each channel, the owner can identify which activities generate meaningful results.
Nevertheless, traffic and engagement alone do not prove that a campaign is successful. A campaign may attract many visitors without generating paying customers.
For better decisions, focus on relevant measures such as:
- Conversion rate from visitors to customers.
- Cost per qualified lead.
- Customer acquisition cost.
- Revenue generated by a campaign.
- Repeat purchases from acquired customers.
In addition, test one change at a time whenever practical. Comparing results before and after a change can help you understand whether the adjustment contributed to better performance.
4. Manage Inventory More Effectively
Poor inventory management can tie up money in unsold products or cause lost sales when popular items run out of stock.
Data analytics helps businesses review product demand, sales history, seasonal patterns, supplier lead times, and current stock levels. These insights support more informed purchasing decisions.
For example, a gift shop may experience higher demand during certain holidays. By examining previous sales and current orders, the owner can prepare for seasonal demand while avoiding excessive purchases.
Inventory analysis can help you:
- Identify fast-selling and slow-moving products.
- Estimate replenishment requirements.
- Reduce avoidable overstocking.
- Detect products that frequently remain unsold.
- Plan purchases around seasonal demand.
However, sales history should not be the only factor in inventory planning. Supplier delays, changing customer preferences, and unexpected events can affect demand. Therefore, review forecasts regularly and maintain suitable stock buffers for important products.
5. Improve Operational Efficiency
Daily operations involve many activities, including order processing, scheduling, customer service, deliveries, and administration. Small inefficiencies can increase costs and reduce customer satisfaction over time.
Operational analytics helps identify where delays, repeated tasks, and unnecessary expenses occur.
For example, a small delivery company might review delivery times by route. If certain routes regularly take longer, the business can investigate traffic conditions, scheduling problems, or inefficient delivery sequences.
Likewise, a service provider can examine how long employees spend completing different tasks. This information may reveal opportunities to improve scheduling, simplify procedures, or automate repetitive administrative work.
By focusing on measurable operational problems, you can make targeted improvements rather than changing processes without clear evidence.
Key Business Metrics Every Small Business Should Track
You do not need to measure everything at once. Instead, choose a small group of metrics that directly supports your business goals.
| Business area | Useful metric | What it helps you understand |
| Sales | Revenue growth | How sales change over time |
| Profitability | Gross profit margin | How much revenue remains after direct costs |
| Marketing | Conversion rate | How effectively visitors or leads take the desired action |
| Customer retention | Repeat purchase rate | How frequently customers return to buy |
| Finance | Operating expenses | How much it costs to run the business |
| Inventory | Stock turnover | How quickly inventory is sold and replaced |
| Customer service | Resolution time | How long it takes to resolve customer issues |
| Cash flow | Operating cash flow | How much cash operating activities generate or consume |
These metrics become more useful when you examine them over time and compare them with appropriate targets.
For example, revenue might increase while profit margins decline. Looking at both measures helps you investigate whether discounts, rising costs, or changes in the sales mix are affecting profitability.
Similarly, a high conversion rate may appear positive, but the business should also consider the value of each sale and the cost of acquiring customers.
Small businesses can also explore how to create a digital marketing budget for a small business to allocate resources effectively and use data-driven insights to make smarter marketing and business decisions.
How Small Businesses Can Start Using Data Analytics
Getting started does not require a complex technology system. A practical approach begins with a clear business question and a manageable set of data.
Step 1: Define a Specific Business Goal
First, identify the problem you want to solve. A broad objective such as improving performance is difficult to measure.
Instead, choose a focused goal, such as reducing stock shortages, increasing repeat purchases, lowering marketing costs, or improving invoice collection.
A clear objective helps you determine which information matters and which metrics you should monitor.
Step 2: Collect Relevant Data
Next, identify where the required information comes from. Depending on your business, useful sources may include:
- Sales and point-of-sale systems.
- Accounting and invoicing software.
- Customer relationship management tools.
- Website and advertising analytics.
- Customer surveys and feedback forms.
- Inventory and order management records.
Keep the process manageable. Start with information that is already available before investing in additional tools.
Step 3: Clean and Organize the Information
Data quality directly affects the usefulness of your analysis. Missing values, duplicate records, inconsistent date formats, and incorrect entries can produce misleading results.
Therefore, establish consistent methods for recording transactions and updating customer or inventory information.
You should also limit access to sensitive customer and financial data. Collect only the information you need, protect it appropriately, and follow applicable privacy requirements.
Step 4: Choose Suitable Analytics Tools
The right tools depend on your budget, technical skills, and business requirements.
A spreadsheet may be sufficient for a small shop that needs to review monthly sales and expenses. An accounting platform can help a growing company monitor financial performance, while a CRM system can organize customer interactions and sales opportunities.
As your needs become more complex, you may consider reporting dashboards or business intelligence software.
Do not purchase advanced software simply because it offers more features. Choose tools that solve a defined problem and provide information you can use.
Step 5: Review Results and Take Action
After organizing the data, compare the results with your original objective.
Look for meaningful patterns, investigate unusual changes, and consider alternative explanations before deciding what to do.
For example, if sales fall during a particular month, check whether the change relates to seasonality, product availability, pricing, marketing activity, or a broader shift in demand.
Then implement a practical adjustment and monitor the results. This process turns analytics into an ongoing business improvement cycle.
The Role of Predictive Analytics in Small Business Growth
Traditional reporting explains what has happened. Predictive analytics uses historical data, statistical methods, and other relevant information to estimate what may happen next.
Small businesses can use predictive methods to support demand planning, cash flow forecasting, customer retention, and staffing decisions.
For instance, a retailer can use past sales and seasonal patterns to estimate future product demand. A subscription-based service can examine customer activity to identify patterns associated with cancellations.
However, predictive results are estimates rather than guarantees. Their accuracy depends on data quality, the suitability of the method, and how closely future conditions resemble past conditions.
Practical Uses of Predictive Analytics
- Demand forecasting: Estimate likely sales to support purchasing and staffing decisions.
- Cash flow forecasting: Estimate future cash inflows and outflows to identify potential shortfalls.
- Customer retention: Identify customer groups that may need additional support or engagement.
- Workforce planning: Estimate busy periods and prepare suitable staffing levels.
Small businesses can begin with basic forecasting features in spreadsheets or business software. More advanced models may become useful when the business has sufficient reliable data and a clear reason to invest in them.
Common Data Analytics Mistakes Small Businesses Should Avoid
Although data analytics offers valuable insights, poor practices can lead to incorrect decisions.
Tracking Too Many Metrics
Monitoring dozens of figures can make it difficult to identify the information that matters most. Instead, focus on a few measures linked to your business objectives.
Ignoring Data Quality
Incorrect or incomplete records can distort reports. Establish consistent data entry practices and review unusual figures before acting on them.
Confusing Correlation With Causation
Two things may change at the same time without one causing the other. For example, higher advertising spending and increased sales may occur together, but other factors could also explain the increase.
Where possible, compare results over suitable periods and use controlled tests to assess whether a change caused the expected outcome.
Relying Entirely on Automated Recommendations
Software can identify patterns, but it may not understand every detail of your business. Combine analytical findings with employee experience, customer feedback, and knowledge of local market conditions.
Overlooking Data Privacy
Customer information must be handled responsibly. Restrict access, use appropriate security measures, and avoid collecting personal information without a legitimate business need.
Frequently Asked Questions
1. Why is data analytics important for small businesses?
Data analytics helps small businesses understand customers, monitor financial performance, identify operational problems, and make decisions based on relevant evidence.
2. Do small businesses need expensive software for data analytics?
No, small businesses can begin with spreadsheets, accounting reports, sales records, and other existing tools before investing in more advanced software.
3. What data should a small business analyse first?
Start with sales, expenses, cash flow, customer behaviour, and inventory information that directly relates to your most important business goal.
4. How often should small businesses review their data?
Review important operational measures weekly or monthly, depending on the business, and examine longer-term trends quarterly or whenever significant changes occur.
5. Can data analytics help a small business increase profits?
Yes, it can help identify opportunities to improve pricing, reduce avoidable costs, strengthen marketing performance, and increase customer retention, although results depend on how effectively the business acts on the findings.