
Running a successful small business requires more than generating sales and serving customers. You also need to understand whether your business is profitable, financially stable, and moving toward its goals. Tracking the right business metrics helps you make informed decisions, identify problems early, and use your resources more effectively.
Many business owners focus mainly on revenue because it shows how much money their business earns from sales. However, rising revenue does not always mean the business is becoming more profitable. Increasing expenses, late customer payments, high marketing costs, and declining customer retention can weaken financial performance even when sales look strong.
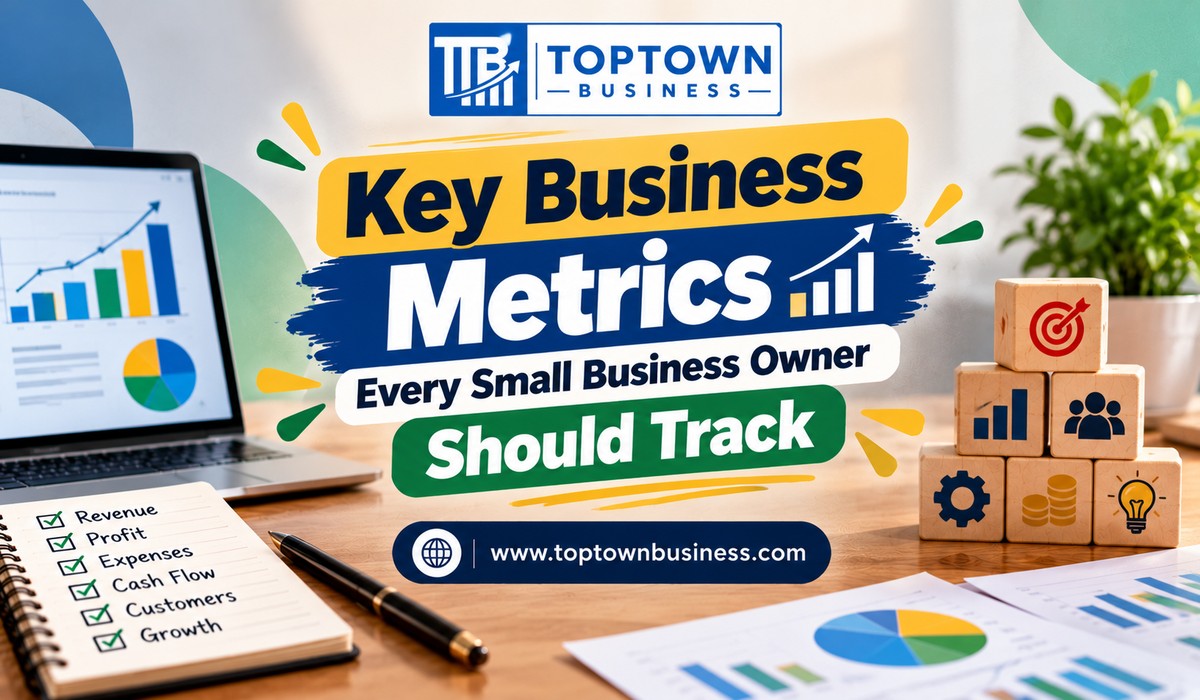
The key business metrics every small business owner should track include revenue, profit margins, cash flow, customer acquisition costs, conversion rates, and employee productivity. The right combination depends on your industry, business model, and stage of growth.
This guide explains the most useful business metrics, how to calculate them, and how to use the results to improve your business performance.
1. Revenue: Measure How Much Your Business Earns
Revenue is the total income your business generates from selling products or services before deducting expenses. It is one of the most basic indicators of business activity and helps you understand whether customer demand is increasing or declining.
Track revenue monthly and compare it with previous months, the same period last year, and your business targets. These comparisons can reveal sales trends and seasonal patterns.
For example, an online store may generate ₹5,00,000 in revenue during one month and ₹6,00,000 the following month. This represents a 20% increase in revenue.
Use this formula:
Revenue growth rate = ((Current-period revenue − Previous-period revenue) ÷ Previous-period revenue) × 100
However, revenue growth alone does not confirm that your business is financially healthy. Sales may increase because you offered large discounts, raised advertising spending, or sold more low-margin products.
Therefore, review revenue alongside profit, cash flow, and operating expenses.
You should also distinguish between sales recorded under your accounting method and cash actually received. If customers purchase on credit, recorded revenue may increase before the money reaches your bank account.
2. Gross Profit Margin: Understand Product or Service Profitability
Gross profit margin shows how much revenue remains after accounting for the direct costs included in your cost of goods sold or service delivery.
It helps you assess whether your pricing and direct costs support a sustainable business model.
Use this formula:
Gross profit margin = ((Revenue − Cost of goods sold) ÷ Revenue) × 100
For example, suppose your business generates ₹4,00,000 in revenue and incurs ₹2,40,000 in direct costs.
Your gross profit is ₹1,60,000, and your gross profit margin is 40%.
This means the business retains ₹40 in gross profit for every ₹100 of revenue before operating expenses and other costs not included in the direct-cost calculation.
Monitor gross profit margin by product, service, or customer segment where your records allow it. This can help you identify offers that contribute more effectively to your business.
If the margin falls, investigate whether supplier prices increased, discounts became more frequent, production costs rose, or your product mix changed.
Do not automatically raise prices whenever margins decline. First, understand the reason and assess whether cost reductions, improved efficiency, or a different product mix could address the problem.
3. Net Profit Margin: Measure Overall Profitability
Gross profit does not tell you how much money your business retains after covering all expenses. Net profit margin provides a broader view by comparing net profit with revenue.
Depending on your accounting approach, net profit generally reflects revenue minus operating expenses, interest, taxes, and other applicable expenses.
Use this formula:
Net profit margin = (Net profit ÷ Revenue) × 100
For example, if your business generates ₹5,00,000 in revenue and records ₹50,000 in net profit, your net profit margin is 10%.
In other words, the business earns ₹10 in net profit for every ₹100 of revenue.
Track this metric regularly to understand whether your business retains enough profit to support its goals. Compare results over time rather than judging performance from a single month.
A declining net profit margin may indicate rising rent, payroll expenses, marketing costs, financing charges, or other overheads.
However, business margins vary by industry and operating model. Compare your results with relevant benchmarks only when the businesses have sufficiently similar costs and revenue structures.
4. Cash Flow: Monitor the Money Entering and Leaving Your Business
Cash flow measures the movement of money into and out of your business. It is essential because you need available cash to pay suppliers, employees, rent, loan instalments, and other obligations.
A business can report a profit but still experience a cash shortage when customers pay late or the business spends heavily on inventory and equipment.
Track cash inflows, cash outflows, and your available balance. In addition, prepare a cash flow forecast to estimate whether you can meet upcoming payments.
A simple cash balance calculation is:
Closing cash balance = Opening cash balance + Cash inflows − Cash outflows
For example, if your business starts a month with ₹1,50,000, receives ₹3,00,000, and pays ₹3,20,000, the closing balance is ₹1,30,000.
Although the business still has cash available, the decrease may require attention if the same pattern continues.
Review your cash position weekly when payments are irregular or cash is tight. Otherwise, a monthly review may be sufficient for routine monitoring.
Also, distinguish operating cash flow from the overall change in your bank balance. Loans, investments, and equipment purchases can affect cash without representing normal operating performance.
5. Accounts Receivable: Track Money Customers Owe You
Accounts receivable represents money customers owe your business for products or services already supplied on credit.
High outstanding receivables can put pressure on cash flow, especially when your own bills become due before customers pay.
Monitor the total amount outstanding, the age of unpaid invoices, and the proportion of invoices that become overdue.
A useful measure is days sales outstanding (DSO), which estimates how many days your business takes to collect payment on credit sales.
A common calculation is:
DSO = (Average accounts receivable ÷ Net credit sales) × Number of days in the period
For example, suppose average accounts receivable is ₹1,00,000, monthly net credit sales are ₹3,00,000, and the period contains 30 days.
DSO = (₹1,00,000 ÷ ₹3,00,000) × 30 = 10 days.
This indicates an average collection period of approximately 10 days under the assumptions used in the calculation.
Compare your DSO with your agreed payment terms and previous periods. A rising figure may indicate slower collections or changes in customer payment behaviour.
To improve collections, send invoices promptly, state payment deadlines clearly, and follow up on overdue accounts consistently.
6. Operating Expenses: Identify Where Your Money Goes
Operating expenses are the costs involved in running your business that are not included in your direct cost of sales. These may include rent, administration, software, utilities, marketing, insurance, and employee-related expenses.
Tracking operating expenses helps you identify unnecessary spending and understand whether your business is becoming more efficient.
Start by categorising expenses into clear groups. Then compare actual spending with your budget and previous periods.
You can also calculate the operating expense ratio:
Operating expense ratio = (Operating expenses ÷ Revenue) × 100
Suppose your business generates ₹6,00,000 in revenue and has ₹1,50,000 in operating expenses.
Your operating expense ratio is 25%.
A rising ratio may indicate that expenses are growing faster than revenue. However, some increases may be planned investments, such as hiring staff or opening a new location.
Therefore, investigate changes rather than automatically cutting costs. Reducing necessary training, maintenance, or customer support could create greater expenses later.
A regular expense review helps you control spending while protecting the activities that support quality and growth.
Tracking the right business metrics also helps you evaluate operational performance, so explore how to build a reliable supplier network for your business to understand the importance of supplier relationships in long-term business success.
7. Customer Acquisition Cost: Measure What It Takes to Win Customers
Customer acquisition cost (CAC) estimates how much your business spends to acquire a new customer.
It helps you evaluate the efficiency of your marketing and sales activities.
Use this formula:
Customer acquisition cost = Total acquisition costs ÷ Number of new customers acquired
Suppose your business spends ₹40,000 on marketing and sales activities during a period and acquires 80 new customers.
Your CAC is ₹500 per customer.
Include the relevant costs consistently. Depending on your business, these may include advertising, sales commissions, campaign expenses, and the portion of employee costs devoted to acquiring customers.
However, define the measurement period carefully. Advertising spending and new customer purchases may not occur at the same time, particularly when your sales cycle is long.
Track CAC by marketing channel where possible. This can show whether paid advertising, referrals, email campaigns, or other activities attract customers efficiently.
A low CAC is not automatically better if it brings customers who rarely purchase or generate little profit. Therefore, review customer acquisition cost alongside customer value, conversion rates, and retention.
8. Customer Lifetime Value: Estimate Long-Term Customer Value
Customer lifetime value (CLV or LTV) estimates the value a customer contributes over the duration of their relationship with your business.
It helps you understand whether your customer acquisition spending is reasonable and why retaining existing customers matters.
A simple estimate for a business with repeat purchases is:
Estimated customer lifetime revenue = Average purchase value × Purchase frequency × Average customer lifespan
For example, if a customer spends an average of ₹2,000 per purchase, makes four purchases annually, and remains a customer for three years, estimated lifetime revenue is ₹24,000.
This is revenue, not profit. To estimate economic value more accurately, account for product or service costs and other relevant expenses.
Customer lifetime value can be difficult to calculate for a new business because customer behaviour may change over time. In that case, begin with actual repeat-purchase data and update your estimate as more information becomes available.
Compare customer value with acquisition cost, but avoid relying on a single ratio without understanding your margins and cash flow.
The goal is to identify customers and acquisition channels that support sustainable profitability.
9. Customer Retention Rate: Understand Whether Customers Return
Customer retention rate measures the percentage of existing customers who remain customers over a specified period.
It is especially useful for subscription businesses, service providers, and retailers that rely on repeat purchases.
Use this formula:
Customer retention rate = ((Customers at the end of the period − New customers acquired during the period) ÷ Customers at the start of the period) × 100
For example, a business starts a month with 200 customers, ends with 220 customers, and acquires 50 new customers.
Retention rate = ((220 − 50) ÷ 200) × 100 = 85%.
This means the business retained 85% of its starting customers during the period under this calculation.
Define what counts as an active customer and select a period that matches your business model. A monthly measure may suit a subscription service, while a retailer with infrequent purchases may need a longer period.
If retention declines, investigate customer feedback, service quality, product performance, pricing, and competitor offers.
Improving retention may reduce pressure on customer acquisition, but the right response depends on why customers leave.
10. Conversion Rate: Measure How Effectively You Turn Interest Into Sales
Conversion rate measures the percentage of people who complete a desired action. For a small business, this may mean purchasing a product, booking a consultation, requesting a quote, or signing up for a service.
Use this formula:
Conversion rate = (Number of conversions ÷ Total eligible visitors or leads) × 100
For example, if 1,000 people visit an online store and 30 make a purchase, the purchase conversion rate is 3%.
Track conversion rates at different stages of the sales process. A business may receive many enquiries but struggle to turn them into paying customers.
For an online store, relevant measures may include product-page visits, add-to-cart activity, checkout completion, and purchases. For a service business, you might track enquiries, consultations, proposals, and signed agreements.
If conversion rates decline, review the customer experience. Confusing pricing, slow website performance, unclear product information, or complicated checkout steps may discourage purchases.
Test improvements carefully and measure the results. A change that increases conversions should also be evaluated for its effect on profit margins and customer quality.
11. Average Order Value: Understand How Much Customers Spend
Average order value (AOV) measures the average amount customers spend per order. It can help you assess purchasing behaviour and evaluate strategies designed to increase order size.
Use this formula:
Average order value = Total sales revenue ÷ Number of orders
For example, if an online store generates ₹3,00,000 from 150 orders, its average order value is ₹2,000.
Businesses can sometimes increase AOV through product bundles, complementary products, suitable minimum-order offers, or premium options.
However, these strategies should provide genuine value. Encouraging customers to buy unnecessary products may harm trust and increase returns.
Track AOV alongside gross profit margin and fulfilment costs. A larger order does not always produce more profit if it requires deep discounts or expensive delivery.
You should also compare AOV across customer segments and marketing channels. This can help you understand which offers attract valuable orders.
12. Inventory Turnover: Track How Efficiently You Sell Stock
Inventory turnover measures how often your business sells and replaces its inventory during a period. It is particularly useful for retailers, wholesalers, and manufacturers.
Use this formula:
Inventory turnover = Cost of goods sold ÷ Average inventory
Suppose your business records an annual cost of goods sold of ₹12,00,000 and average inventory of ₹3,00,000.
Inventory turnover is four times per year.
A low turnover rate may indicate slow-moving stock, excess purchasing, or weaker demand. Meanwhile, a very high rate could signal efficient stock management or insufficient inventory that risks stockouts.
The appropriate level varies by industry, product type, and supplier lead times.
Track turnover alongside stock availability, product margins, and unsold inventory. This helps you avoid reducing stock levels so aggressively that you lose sales.
Review individual product categories where possible, because fast-moving products can hide slow-moving items in an overall average.
13. Employee Productivity: Evaluate How Effectively Your Team Works
Employee productivity measures how effectively your business turns labour and other resources into useful output.
The best indicator depends on the role. A retailer may monitor sales per employee, while a service company may measure completed projects, billable utilisation, or turnaround time.
Possible indicators include:
- Orders processed per employee.
- Projects completed within agreed deadlines.
- Revenue or contribution per employee.
- Error rates and rework.
- Customer satisfaction.
- Time required to complete recurring tasks.
For example, if your team processes more orders in the same amount of time without increasing errors or complaints, your operations may have become more efficient.
However, avoid relying on output volume alone. Employees who rush through tasks may create quality problems or weaken customer service.
Use productivity metrics to identify training needs, improve workflows, and balance workloads. Discuss results with employees and consider the quality and complexity of their work.
A useful measurement system encourages improvement rather than creating unnecessary pressure.
14. Choose the Right Business Metrics for Your Goals
Tracking too many metrics can make financial management complicated. Instead, choose a focused set that helps you make specific decisions.
Your priorities may differ depending on the stage and type of your business.
| Business goal | Useful metrics |
| Improve profitability | Gross profit margin, net profit margin, operating expenses |
| Strengthen cash management | Cash flow, accounts receivable, days sales outstanding |
| Grow sales | Revenue growth, conversion rate, average order value |
| Improve marketing efficiency | Customer acquisition cost, conversion rate, customer lifetime value |
| Improve customer loyalty | Retention rate, repeat-purchase rate, customer feedback |
| Manage inventory | Inventory turnover, stockouts, slow-moving stock |
| Improve operations | Employee productivity, error rates, delivery performance |
Start with five to eight metrics that directly support your current business goals. You can expand the list when your reporting systems and management needs become more complex.
For each metric, define how you calculate it, where the data comes from, how often you review it, and who is responsible for monitoring it.
Consistent definitions matter. If you change the way you calculate a metric every month, comparisons become less useful.
15. Build a Simple Business Metrics Review Routine
Business metrics provide value when you use them to make decisions. Collecting figures without reviewing them or taking action will not improve performance.
Create a regular review routine that fits your business.
Weekly review: Check cash balances, upcoming payments, overdue invoices, sales activity, and urgent operational issues.
Monthly review: Compare revenue, margins, expenses, customer acquisition costs, retention, and other key measures with your targets.
Quarterly review: Assess broader trends, pricing, marketing performance, customer segments, inventory strategy, and progress toward business goals.
Use a spreadsheet or accounting dashboard to organise your figures. Many small businesses can begin with existing accounting records and a few simple calculations before investing in specialised analytics tools.
When a metric changes, investigate the reason. For example, falling profit margins may result from supplier price increases, discounting, or a change in the products customers buy.
Then choose a specific action, assign responsibility, and review whether the change improves the result.
This approach turns business metrics into a practical decision-making tool rather than a collection of numbers.
Frequently Asked Questions
1. What are the most important business metrics for small businesses?
Revenue, gross profit margin, net profit margin, cash flow, operating expenses, customer acquisition cost, and customer retention are useful starting points for many small businesses.
2. How often should small business owners track their metrics?
Review cash flow and urgent operational indicators weekly, examine financial and customer performance monthly, and assess broader trends and business goals quarterly.
3. Which business metrics help measure profitability?
Gross profit margin, net profit margin, operating expenses, and contribution margin help businesses understand profitability and identify where costs may be reducing earnings.
4. Can a business grow revenue but still lose money?
Yes. Revenue can increase while expenses, discounts, financing costs, or other outgoings rise even faster. Therefore, business owners should track profit margins and cash flow alongside sales.
5. How can a small business track metrics without expensive software?
Start with accounting reports, bank records, spreadsheets, and simple calculations. Review the figures consistently and consider specialised software when your reporting needs become more complex.